System-Level Android Performance Analysis and Tuning with Systrace and Perfetto
Introduction: Look Beyond the App Boundary
When an Android app runs into performance problems such as UI jank, slow startup, excessive power consumption, or generally sluggish response, app-level profilers like Android Studio’s CPU Profiler or Memory Profiler are often not enough to find the root cause. Those tools are useful for identifying code hot spots or memory leaks inside the app, but many difficult performance problems come from the interaction between the app, Android system services, the Linux kernel, and hardware, or from resource contention across processes and threads. To diagnose those problems, we need tools that can cross app boundaries and show the whole system.
Systrace is older but still useful for its mental model, while Perfetto is the modern, more powerful standard built into Android. Both are system tracing tools. They record detailed events and states across layers of the system over a short time window, including CPU scheduling, I/O, Binder IPC, the graphics pipeline, memory events, and power state. The result is visualized on a timeline.
For Android developers, being fluent with Perfetto, and with the analysis concepts inherited from Systrace, is a core skill for diagnosing hard performance issues, understanding how the system actually behaves under load, and driving deeper optimization work. The point is not only knowing how to operate the tool; it is being able to read the system behavior hidden inside the trace data.
This article focuses on modern Perfetto while borrowing Systrace’s core analysis ideas. It covers:
- The Perfetto framework: architecture and data sources
- Trace capture: capture methods and configuration
- Perfetto UI concepts: timelines, tracks, slices, counters, and more
- Deep reading of key tracks: CPU scheduling and states, Binder transactions, the graphics pipeline, memory events, and power management
- Typical analysis workflows: diagnosing jank, slow startup, and high power consumption
- Custom tracing: adding app-level analysis anchors with atrace
- Advanced Perfetto features: SQL queries and Trace Processor
1. Perfetto: The Modern Android Tracing Framework
Perfetto is Google’s next-generation, high-performance, low-overhead system tracing and analysis framework. It has become the standard performance analysis tool on Android.
Core Architecture
Data sources and probes collect data, including:
- Kernel ftrace events for scheduling, system calls, disk and network I/O, and related activity
- User-space atrace events for Android Framework traces and app-defined trace points
- heapprofd for native memory profiling
- Process states, counters, and other system statistics
The tracing daemon (traced) runs on the device and starts or stops probes according to the configuration while managing trace buffers.
Trace Processor is a standalone library and command-line tool that parses binary trace files, converts them into structured data, and exposes query interfaces such as SQL.
The UI is a web-based visual analyzer at ui.perfetto.dev that loads trace files for interactive analysis.
Rich Data Sources
Perfetto can integrate data across many system layers:
- Kernel: CPU scheduling (
sched_switch,sched_wakeup), system calls, disk I/O (diskio), network (net), interrupts (irq), and more - Android Framework and system services: key atrace categories such as view system (
view), window manager (wm), activity manager (am), graphics (gfx), input (input), Binder driver (binder_driver), HAL (hal), and others - Apps: app-defined atrace points through
Trace.beginSection, plus ART runtime information such as GC events and JIT compilation - Native processes: native heap allocation through
heapprofd, and memory error detection through HWASan or ASan on specific builds - Hardware: CPU frequency (
cpufreq), CPU idle state (cpuidle), GPU activity on some devices, memory bandwidth, and power-related counters on some devices
Trace Capture Methods
Android Studio Profiler: choose the “System Trace” recording mode in the CPU Profiler. It is easy to use and works well for debugging app behavior, but the configuration options are limited.
The on-device System Tracing app in Developer Options: provides a graphical interface for choosing common atrace categories, buffer size, duration, and related options. It is useful for recording system-wide behavior or reproducing a specific issue. The output is a .perfetto-trace or .trace file.
The Perfetto Web UI recording page (ui.perfetto.dev -> Record new trace): connects to the device through ADB and exposes detailed configuration options. You can choose ftrace events, atrace categories, and individual data-source probes precisely. This is a good option for advanced users who need fine-grained capture.
The adb shell perfetto command line: the most flexible and powerful option. It uses a text-format config file, in TextProto format, to define data sources, buffer modes such as ring buffer or long trace, duration, triggers, and more. It is especially useful for automated tests or complex capture setups.
Example key configuration parameters in TextProto:
buffers { /* ... size, fill_policy ... */ }
data_sources {
    config {
        name: "linux.ftrace"
        ftrace_config {
            ftrace_events: "sched/sched_switch"
            ftrace_events: "sched/sched_wakeup"
            atrace_categories: "view"
            atrace_categories: "wm"
            // ... other ftrace events or atrace categories
        }
    }
}
data_sources {
    config {
        name: "linux.process_stats"
        process_stats_config { /* ... options ... */ }
    }
}
duration_ms: 10000 // Record for 10 seconds
2. Working with the Perfetto UI: Core Concepts
After loading a trace file, understanding the basic UI elements is the first step toward useful analysis.
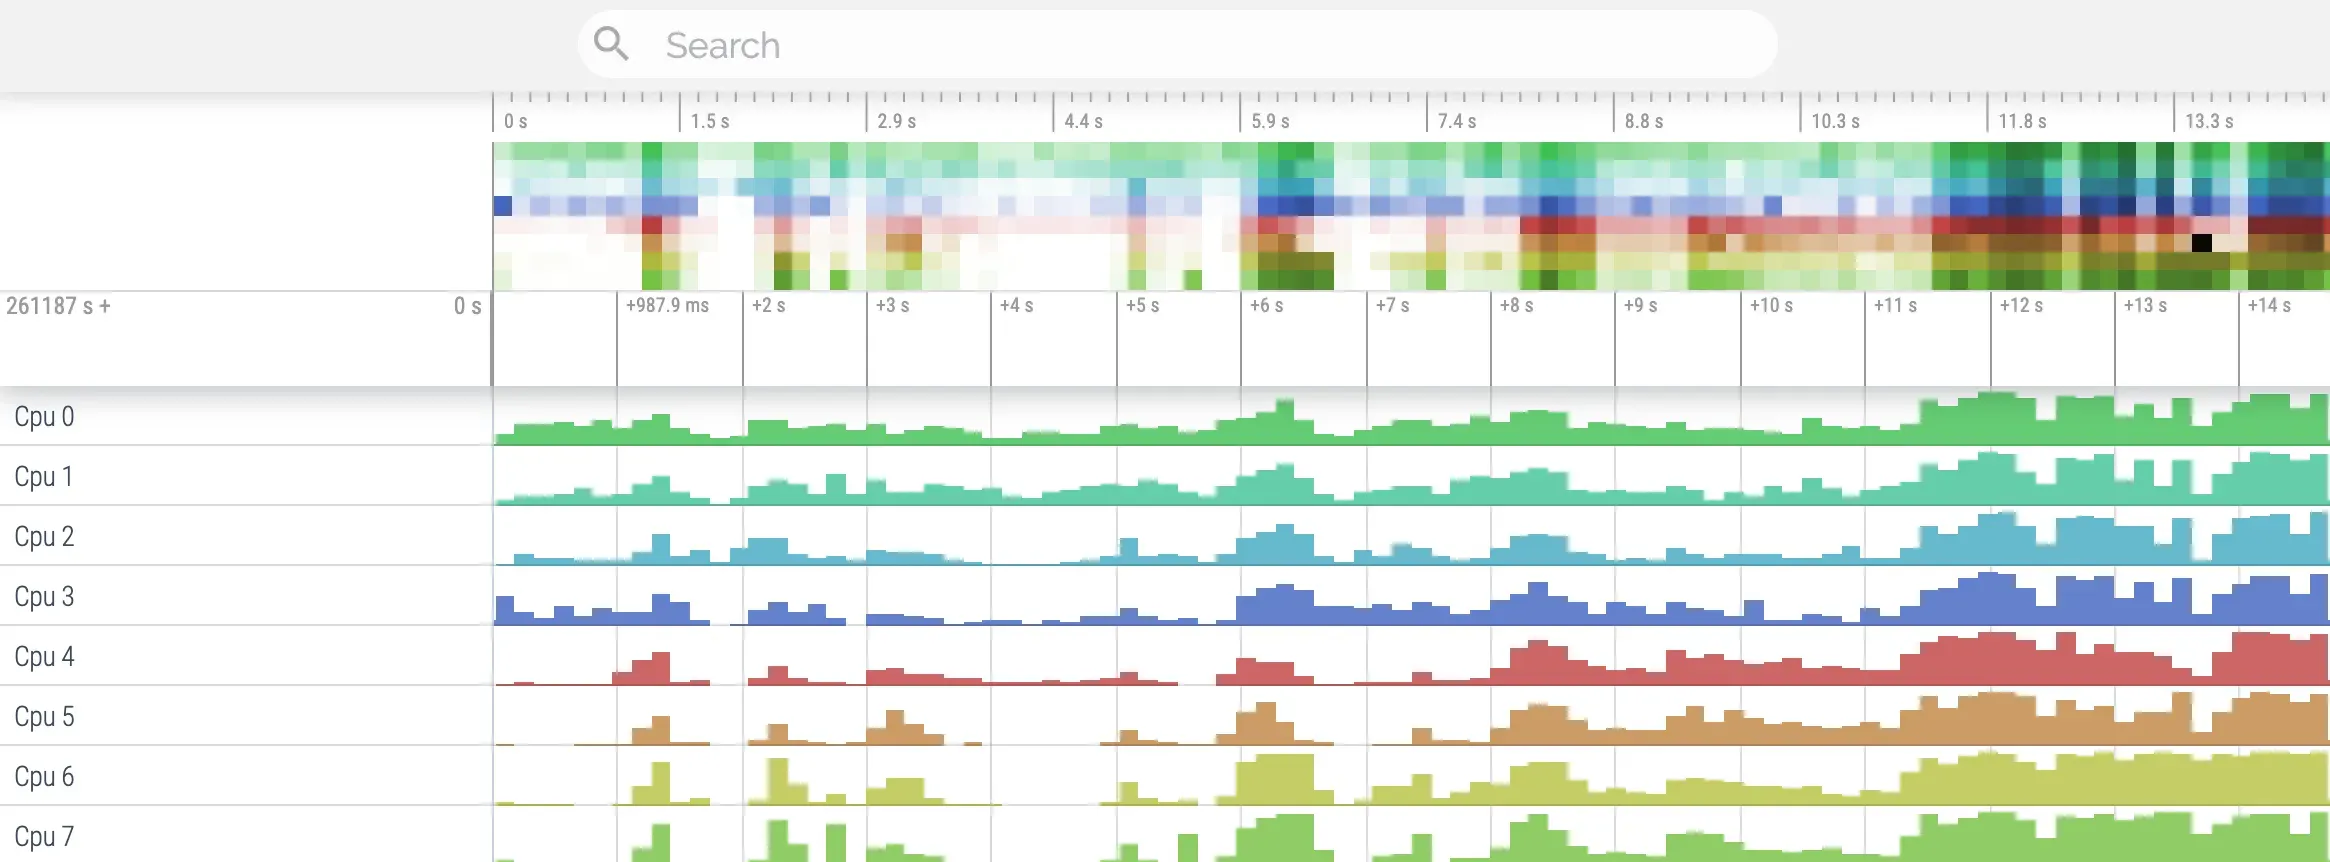
Timeline
The top area shows the time scale. You can zoom and pan it, then select the time range you want to analyze.
Tracks
Tracks are horizontal rows representing different data sources or dimensions, for example:
- One track for each CPU core
- One track group for each process, with thread tracks inside it
- Tracks for specific system events, such as VSYNC signals
- Counter tracks, such as CPU frequency or memory usage
Slices
Slices are colored rectangles on tracks. They represent events or states with a start time and an end time:
- CPU track slices: time ranges where a thread ran on that CPU
- Thread state slices: time ranges where a thread was in a state such as Running, Runnable, or Sleeping
- Atrace section slices: code regions wrapped by
Trace.beginSectionandTrace.endSection - Binder transaction slices: time spent in Binder calls
When you click a slice, the details panel shows its name, start time, duration, related thread or process, arguments, and other metadata.
Counters
Counters show numeric values over time, such as CPU frequency, memory PSS, or battery level.
Instant Events
Instant events appear as diamonds or vertical marks on the timeline. They represent events that happened at a specific moment, such as sched_wakeup.
Pinning and Filtering
You can pin important tracks or threads to the top, or use the search box to filter tracks and slices by name. This helps keep the analysis focused.
Flow Events
Flow events connect related slices with arrows, showing causal or process relationships. Examples include Binder call initiation, execution, and reply, or the path from sched_wakeup to the thread actually entering the Running state. They are very helpful for understanding cross-thread and cross-process interactions.
Info and Tabs Panel
The bottom panel shows details for the selected item, such as a slice or time range, across several tabs:
- Current selection: details for the current selection
- Thread States: distribution of thread states within the selected range
- Logcat: logcat entries for the selected time range, if included in the trace
- Android Logs: system event logs, if included
- SQL Query: a powerful tab for running SQL queries against trace data
- Critical Path: analysis of the key path that delayed a selected slice
- Slice Details: detailed attributes for the selected slice
3. Key Track Analysis: Extracting Truth from Data
Understanding what key tracks carry is the core of performance analysis.
CPU Scheduling and States
CPU core tracks such as CPU 0, CPU 1, and so on
Questions to ask: which thread ran on which core? Was the CPU busy? Was there long idle time? Under high load, were tasks distributed reasonably across big and little cores? Each slice represents a segment of execution on that core.
Thread state tracks, expanded under a process or thread, are extremely important
- Running, shown in green: the thread is executing instructions on the CPU
- Runnable, often light green or white: the thread is ready to run but has no available CPU core and is waiting to be scheduled. A long Runnable state, especially on the UI thread or RenderThread, is a clear signal of CPU contention and directly causes latency and jank
- Sleeping, often gray or dark gray for interruptible sleep: the thread voluntarily gave up the CPU while waiting for an event. Common waits include:
- Waiting for a kernel timer, such as
hrtimer_expire_entry - Waiting for a lock, such as
mutex_lockorfutex_wait - Waiting for I/O completion, such as
binder_thread_readwaiting for a Binder reply orvfs_readwaiting for disk data - Waiting in
Object.wait()orCondition.await()
- Waiting for a kernel timer, such as
- Uninterruptible Sleep, often red or orange: the thread is waiting in kernel mode for an operation that cannot be interrupted, usually disk I/O or certain kernel locks. A long time in this state often indicates a serious I/O bottleneck or kernel issue
- Blocked, waiting for I/O: a specific state for waiting on disk I/O completion
sched ftrace events
sched_switchrecords every CPU context switch. The details panel shows the outgoing thread, such asprev_comm,prev_tid, andprev_state, and the incoming thread, such asnext_commandnext_tid, along with priorities. This helps analyze preemption and scheduling latency.sched_wakeuprecords a thread wakeup. The details panel shows the awakened thread, such ascommandtid, and the thread that woke it, such aswake_commandwake_tid. Combined with flow arrows, it clearly shows the scheduling delay between wakeup and actual Running state.
Analysis checklist
- Find why key threads, such as the UI thread, RenderThread, Binder threads, or worker threads, stay Runnable for too long. Is CPU capacity insufficient? Are they preempted by higher-priority threads?
- Find why key threads stay Sleeping for too long. Which lock, Binder call, or I/O operation are they waiting for? Use flow arrows or
sched_wakeupinformation to trace the wakeup source. - Identify unreasonable Uninterruptible Sleep periods.
- Check whether the scheduling delay from wakeup to Running is too long.
Binder Transactions
binder_transactionslices represent synchronous Binder calls between the caller thread and the target thread. The slice length represents the total round-trip time, or RTT.binder_transaction_asyncslices representonewaycalls.binder_lockslices represent time spent acquiring the Binder driver’s global lock. They should usually be short and infrequent. Frequent or longbinder_lockcontention indicates a bottleneck in the Binder driver layer.
Analysis checklist
- Locate long transactions: long
binder_transactionslices are common causes of ANRs and main-thread blocking. - Break down time: a long transaction may come from client-side data preparation, Binder driver transfer or scheduling, server-side
onTransactexecution, or Binder driver return. Combine this with CPU and state analysis on the server thread to determine which side is the bottleneck. - Queueing and delay: If the target service’s Binder thread pool stays Runnable or Running for a long time, and new
binder_transactionslices start only after a visible delay following the target thread’s Sleeping state, requests may be queueing or the thread pool may be exhausted. - Connect thread state: check whether the caller thread is Sleeping during the Binder call.
Graphics Pipeline, the Core of Jank Analysis
App UI thread
Choreographer#doFrameslices are central. They represent the UI thread’s work for rendering a frame. The duration must stay below the VSYNC interval, such as 16.6 ms. They usually include:performTraversals: total time for measure, layout, and drawing record operations into RenderNodesonMeasure,onLayout, andonDraw: time in specific View methods when atrace markers or CPU sampling are availabledrawandsyncAndDrawFrame: drawing-record work and synchronization with RenderThread
App RenderThread
DrawFrameslices are also central. They represent RenderThread’s work for rendering a frame, including processing RenderNodes and issuing HWUI commands to the GPU. They should also stay below the VSYNC interval as much as possible, while running in parallel with UI-thread work.- Internal details may include slices such as
syncFrameState,nSyncAndDrawFrame,render, andupload.
SurfaceFlinger process (surfaceflinger)
onMessageReceived,handleMessageInvalidate, andhandleMessageRefresh: SurfaceFlinger responds to VSYNC and prepares to compose a new frame.latchBuffer: SurfaceFlinger obtains the newly rendered buffer from the app’s BufferQueue. If the app fails to provide a buffer on time, you may see delay here or reuse of an old buffer.performComposition: SurfaceFlinger performs composition through HWC or GPU. This should not take too long.- BufferQueue events: events such as
queueBuffer,acquireBuffer, andreleaseBuffermay appear under the app process or SurfaceFlinger process. They show buffer flow state.
VSYNC signal tracks, such as VSYNC-app and VSYNC-sf, provide the frame-time reference lines.
Critical Path analysis in Perfetto UI can automatically analyze and highlight the chain of events that delayed a frame. Select a long DrawFrame or doFrame slice, then inspect the tab at the bottom. The path may cross the UI thread, RenderThread, and SurfaceFlinger.
Analysis checklist
- Find janky frames through FrameTimeline or by manually observing long
doFrameorDrawFrameslices. - Determine whether the UI thread is slow, and which stage is slow: measure, layout, draw, sync, or a specific method. Or determine whether RenderThread is slow because of heavy GPU work or slow uploads, or whether SurfaceFlinger is slow because composition is expensive or it is waiting for a buffer.
- Combine the graphics view with CPU state analysis. Is the root cause CPU contention, lock waiting, or I/O?
Memory Events
- GC pauses may show up on the UI thread track as short Sleeping periods or monitor contention if GC needs locks. ART trace events such as
gc_pause_startandgc_pause_end, or logcat entries, can confirm the cause. Long or frequent GC pauses directly cause jank. - Memory counters, such as
mem.*tracks, show trends for Java heap, native heap, PSS, and related metrics. Correlate them with GC events to see whether GC is reclaiming memory effectively. Correlate them with app operations to find actions that trigger memory spikes. Perfetto itself does not directly locate leaks, but memory trends provide useful context for heap dump analysis. oom_score_adjchanges help monitor process priority changes and understand LMK behavior.
Power and Frequency
- CPU frequency (
cpufreq) shows whether CPUs are running at low frequencies, possibly due to system power policy or thermal throttling. Low frequency directly slows down all compute work. - CPU idle (
cpuidle) helps analyze whether the device can enter deep sleep states to save power. Frequent wakeups increase power consumption. - Battery (
batt), when supported by the device, shows power drain rate and temperature changes. Correlate power peaks with high CPU activity, wakelocks, network activity, and related events in the trace. - Wakelocks show which components hold wake locks and prevent the device from sleeping. Look for unnecessary or long-held wakelocks.
4. Methodology for Common Performance Problems
Diagnosing UI Jank
Goal: find why Choreographer#doFrame or RenderThread#DrawFrame exceeded the frame budget.
Workflow:
- Capture a Perfetto trace that includes the janky scenario. Enable
sched,gfx,view,wm,am,binder_driver,freq, anddalvikcategories. - In the Perfetto UI, locate the dropped-frame region, such as a long bar in FrameTimeline.
- Select the UI-thread
doFrameslice for the problematic frame. - Analyze the slice’s internal structure and thread state:
- Internal time: is measure/layout long, draw recording long, or sync long? Use atrace or CPU sampling to locate the specific slow View or method.
- Thread state: during the slice, was the UI thread Running for a long time, meaning the code itself was slow? Was it Runnable for a long time, meaning the thread was ready to run but was preempted? Was it Sleeping for a long time, meaning it was waiting for a lock, Binder, or I/O?
- If the thread was Runnable, check which other thread or process occupied CPU time.
- If the thread was Sleeping, inspect the dependency it was waiting for, such as the lock owner, Binder peer, or I/O operation.
- Check whether RenderThread’s
DrawFramealso exceeded the frame budget and analyze why, such as GPU load or synchronization waiting. - Check whether SurfaceFlinger received the buffer on time.
- Use Critical Path analysis.
- Check for concurrent GC pauses.
Diagnosing Slow App Startup
Goal: find the slowest stage between process creation and the first completed frame.
Workflow:
- Capture a Perfetto trace that covers cold start. Enable
sched,activity,view,binder_driver,dalvik,diskio, andpackage_manager. A command-line Perfetto run combined witham startmay be useful. - Locate key timestamps in the trace: process start,
bindApplication,Application.onCreate,ActivityThreadMain,Activity.onCreate,Activity.onResume, firstChoreographer#doFrame, firstRenderThread#DrawFrame, and SurfaceFlinger composition. - Measure the duration of each stage.
- Focus on the main-thread behavior in the slowest stage:
Application.onCreate: is there synchronous I/O, heavy initialization, or lock waiting?Activity.onCreateorActivity.onResume: is there complex layout inflation, synchronous data loading such as network or database work, or expensive computation?- First draw: are measure, layout, or draw slow? Is shader compilation involved?
- Check the main-thread state. Is there a lot of Runnable time because the system is busy during startup and CPU is contested? Is there Sleeping time because of I/O, a common startup bottleneck?
- Check Binder calls. Does startup depend on system services that respond slowly?
- Check disk I/O tracks. Are there many expensive reads or writes?
- Check GC activity. Is GC frequent during startup?
Diagnosing High Power Consumption
Goal: find why the device cannot sleep or why CPU and hardware stay under high load.
Workflow:
- Capture a longer Perfetto trace during the problematic scenario, such as background standby. Enable
power,cpufreq,cpuidle,sched,wakelock,net,disk,sync, andbattery. - Wakelock analysis: inspect wakelock tracks and look for long-held
PARTIAL_WAKE_LOCKinstances that prevent CPU sleep. Identify the app or service holding the wakelock. - CPU state analysis: check whether CPUs enter deeper idle states through
cpuidletracks. If CPUs remain Running or in shallow idle states, find the thread or process responsible through CPU scheduling tracks. - CPU frequency analysis (
cpufreq): check whether CPUs stay at high frequencies for long periods and what work is causing that. - Background activity analysis: look for unnecessary network polling through
net, disk reads and writes throughdiskio, background sync throughsync, and background worker activity in related process or thread tracks. - Correlate battery data: align peaks in battery drain rate on
batttracks with the activity peaks above.
5. Custom Tracing
To pinpoint time spent inside app logic more precisely, add custom trace points.
Purpose: mark the start and end of specific logic blocks in app code, such as data loading, image processing, or complex computation, so Perfetto shows corresponding slices and durations in the system trace.
Method: use the android.os.Trace class.
import android.os.Trace;

// Method 1: wrap a code block. Recommended.
Trace.beginSection("DataParsing"); // Use a descriptive section name.
try {
    // ... Execute data parsing logic ...
    parseData(rawData);
} finally {
    Trace.endSection(); // Must be called in finally to guarantee pairing.
}

// Method 2: async trace for asynchronous work across threads or callbacks.
// String cookie = "MyAsyncTaskCookie:" + System.nanoTime();
// Trace.beginAsyncSection("LoadResource", cookie.hashCode());
// // ... Start asynchronous work ...
// // In the callback when the async work completes:
// Trace.endAsyncSection("LoadResource", cookie.hashCode());Viewing: custom sections appear as colored slices on the corresponding thread tracks.
Practical advice: add trace points strategically on key business paths, functions expected to take meaningful time, core algorithms, and UI rendering preparation such as data conversion. Avoid adding too many markers, because that can make traces harder to read and add overhead. Use meaningful and unique section names.
6. Advanced Perfetto Features: Unlocking the Full Toolset
SQL Query Engine
Capability: query the low-level data in a trace file directly with SQL-like syntax. The data is stored in virtual tables.
Use cases:
- Aggregation: calculate total count, total duration, average duration, maximum duration, or P90 duration for specific events, such as average RTT for all
binder_transactionslices or total Runnable time on the UI thread - Pattern matching: find complex event sequences, such as all
sched_wakeupevents followed by long Runnable periods - Custom metrics: compute app-specific or system-specific performance metrics from raw data
- Data export: export query results for further analysis or visualization
- Learning: understand the Perfetto trace data model and available virtual tables. The UI’s “Query (SQL)” tab is the right place to practice and run queries.
Trace Processor
Command-line tool: parse trace files, run SQL queries, and calculate predefined performance metrics without using the UI.
Use cases: integrate Perfetto into automated performance test frameworks for regression detection, or perform offline analysis on large sets of trace files.
7. Conclusion: Trace in Hand, Performance Under Control
Systrace and Perfetto are irreplaceable tools for system-level performance analysis and tuning on Android. Their global view and detailed data let us drill into apps, the Framework, the kernel, and even hardware, exposing the real roots of bottlenecks that are otherwise hidden behind surface symptoms.
Mastering Perfetto is not only about learning the UI. It requires a deep understanding of what the core tracks mean, including CPU scheduling, Binder, graphics, memory, and power. It also requires systematic analysis methods for different problems such as jank, slow startup, and high power use, plus the ability to apply custom tracing and advanced SQL queries when needed.
The ability to perform system-level trace analysis is one of the strongest signals of an advanced Android performance engineer. With that skill, you can face complex performance challenges with confidence and push both app performance and user experience to a higher level.
Further Reading
- Back to the Android Performance topic
- Android Startup Optimization: Perfetto Practice from Zygote Fork to First Frame
- Android App Startup Optimization: Metrics, Flow, Tools, and Governance
- RecyclerView Cache Internals: Four-Level Cache, Reuse, and Prefetch
- Android Bitmap Memory Model: Java Heap, Native Heap, and Hardware Bitmap